728x90
지나온 캔들 수 만큼을 나눠서 진행하는 이동평균선 트레이딩뷰 파인 스크립트입니다.
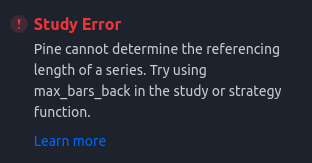
기간이 너무 길면 아래 오류가 나거나,

max_bars_back 옵션을 빼면 아래 오류가 납니다.
//@version=5
indicator("indicator", overlay=true, max_bars_back = 4999)
starttime = input.time(title = "starttime", defval = timestamp("20 Dec 2022 00:00 +0000"))
anchorBarIndex = (time - starttime) / (1000 * timeframe.in_seconds(timeframe.period))
anchorBarsBack = bar_index - anchorBarIndex
plot(anchorBarIndex,"anchorBarIndex")
plot(anchorBarsBack,"anchorBarsBack")
plot(bar_index,"bar_index")
// len = input.int(74, minval=1, title="Previous Candle Count")
offset = 0
accumulated_close = 0.0
x = anchorBarIndex
close_() => close
while offset < x
accumulated_close := accumulated_close + close[offset]
offset := offset + 1
plot(accumulated_close, "accumulated_close")
plot(x, "x")
snail_ma = accumulated_close / x
// max_bars_back(snail_ma, 100)
// out = if x>0
// snail_ma[0]
// else
// snail_ma
plot(snail_ma, color=color.purple)
// line ln = na
// line.delete(ln[1])
// ln := line.new(bar_index - 1, out[0], bar_index, out[0], width=2, color=color.purple, extend=extend.both, style=line.style_solid)
728x90
'WEB' 카테고리의 다른 글
| telegram Bad Request: chat not found (0) | 2023.06.11 |
|---|---|
| 트레이딩뷰 웹훅 alert 텔레그램으로 보내기(tradingview webhook telegram) (0) | 2023.06.08 |
| VOLUME BASED RSI PINE SCRIPT (0) | 2023.06.05 |
| docker+flask 초기 세팅 (0) | 2021.08.03 |
| tomcat console 한글 깨짐 (0) | 2020.01.19 |